Turn analysis into something your team can use.

A useful answer should not end in a conversation. Create a live App, share a polished report, or send a decision-ready file.

Choose the format the decision needs

Explore a question live, share a polished story, or send a file where the work will happen next.
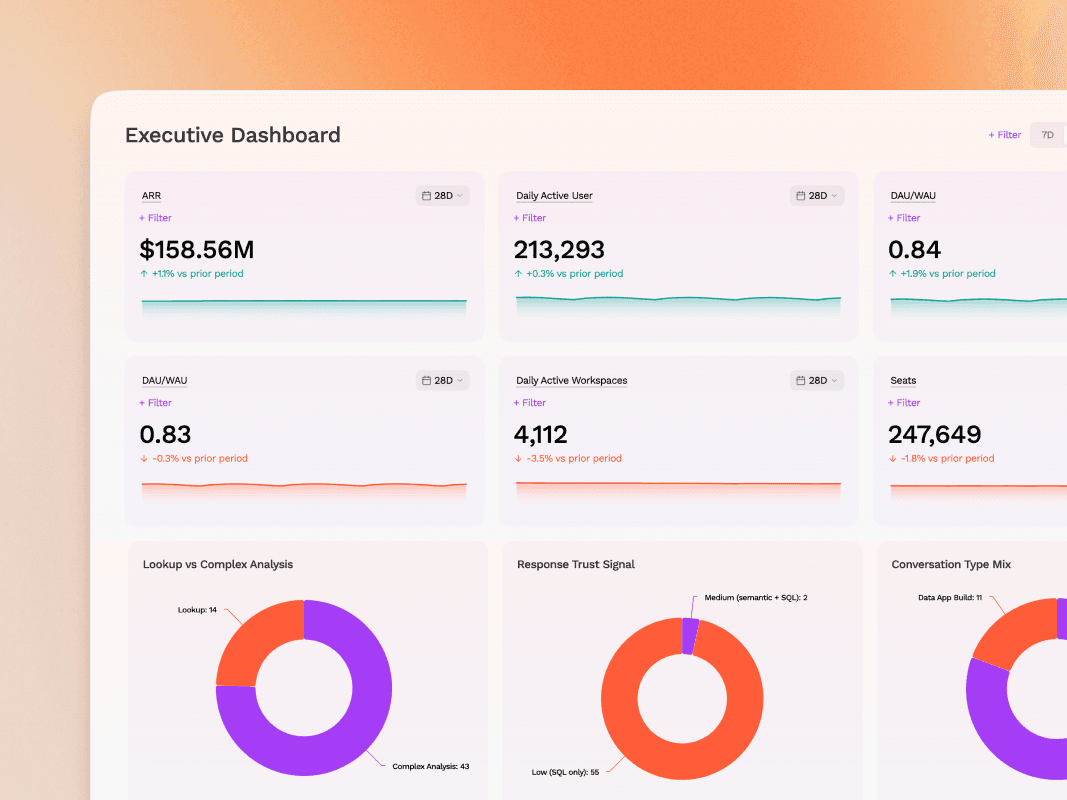
Sundial App in the Library

Apps

Refreshable, interactive views for the metrics your team returns to, with filters to explore what changed.
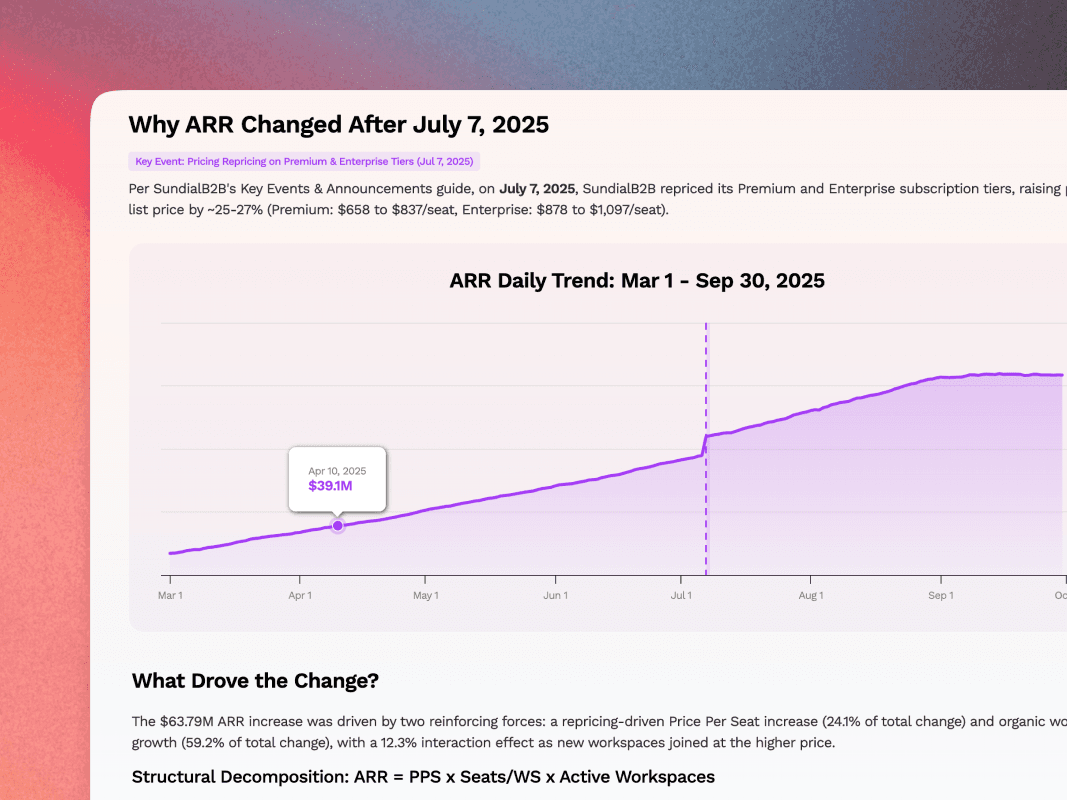
Sundial Report in the Library

Reports

Polished, shareable HTML analysis that brings the findings, evidence, and narrative together in a clear story.
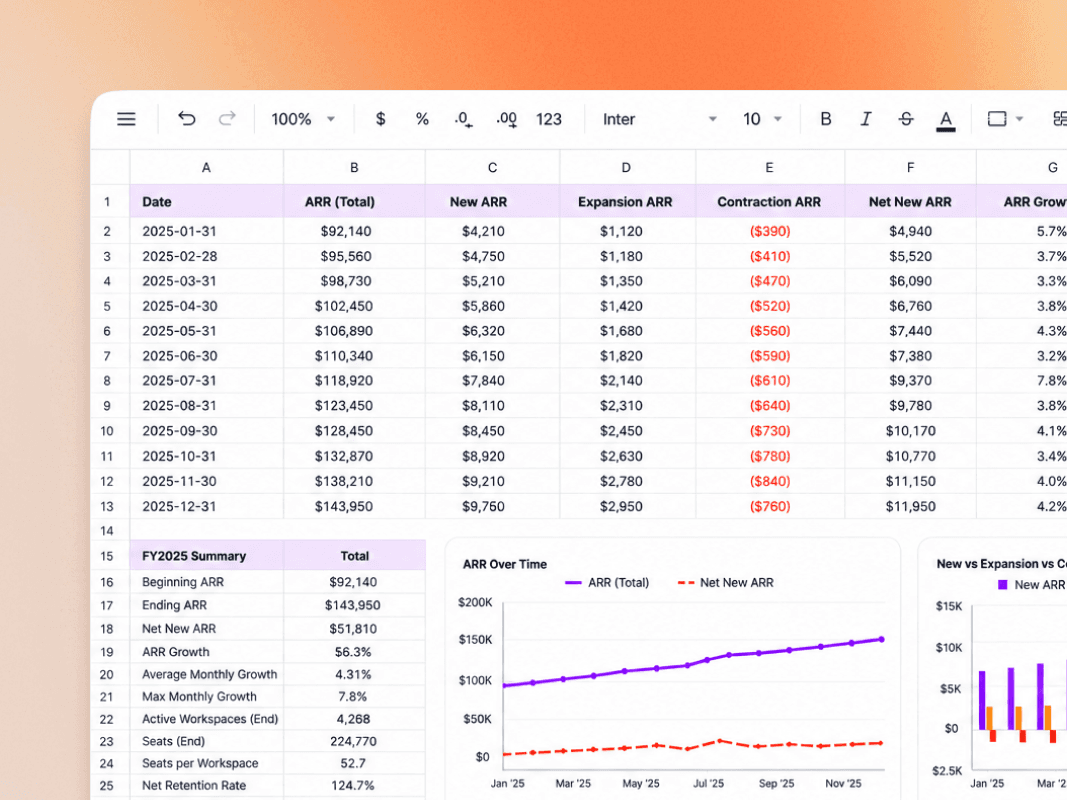
Financial spreadsheet workbook

Files

Decision-ready files like PDFs, slide decks, or Excel files for meetings, presentations, and downstream work.
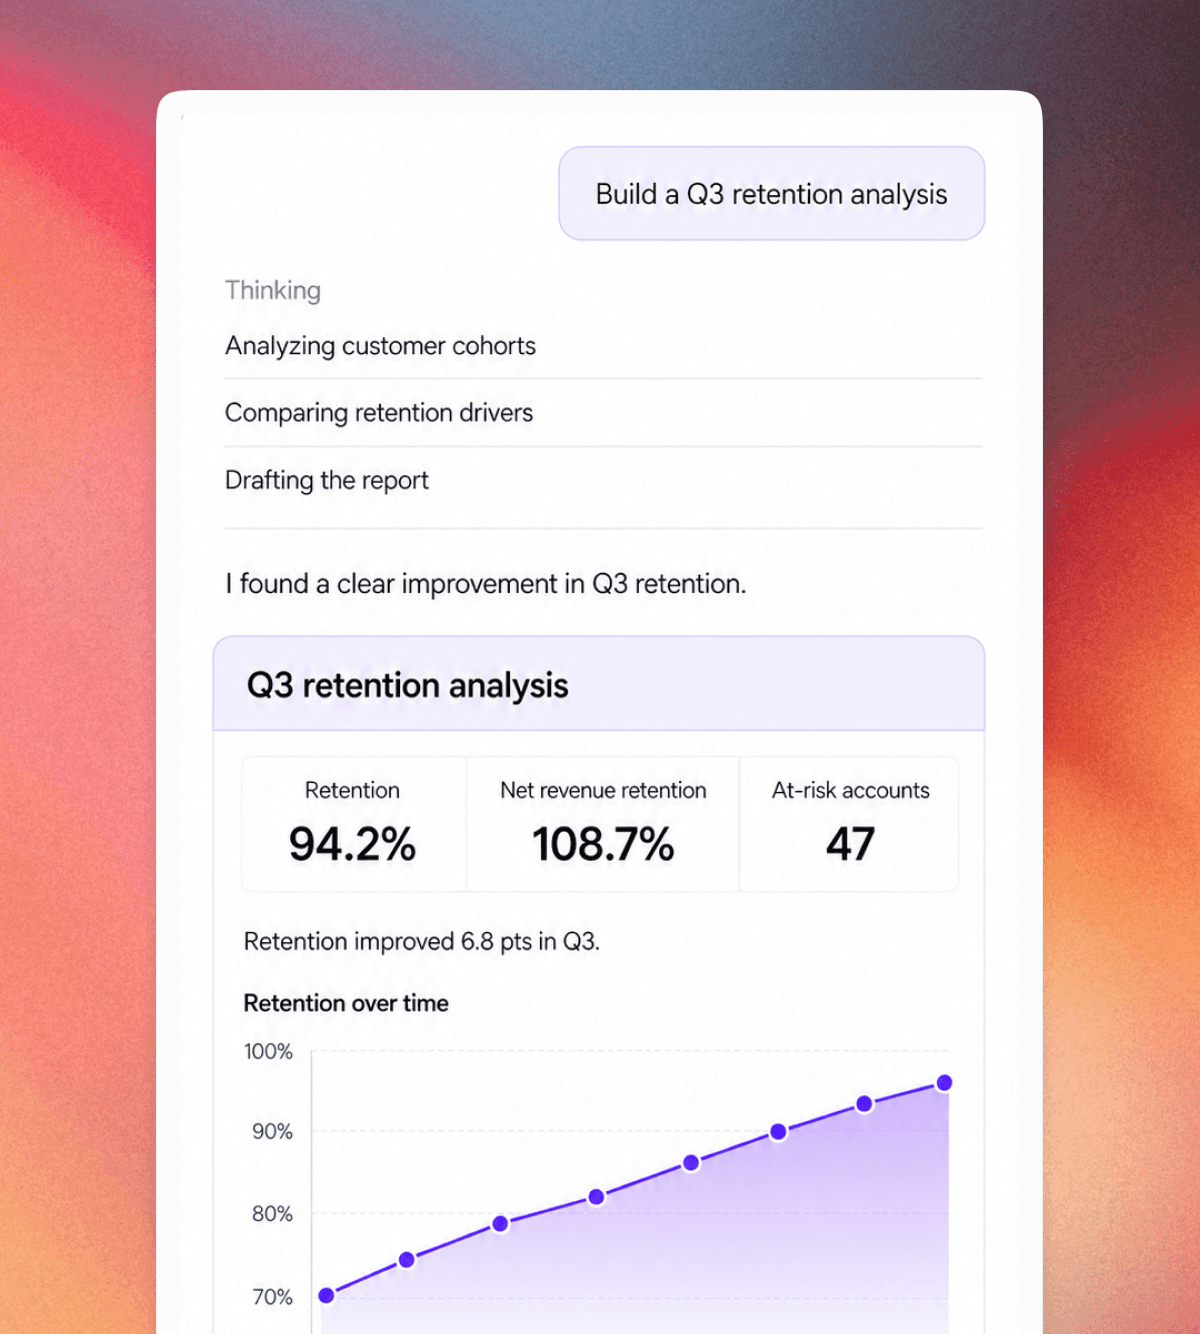
Analysis Agent turns a Q3 retention question into a detailed report

One trusted workflow, built to scale.

Create once, choose the right format, and keep every useful answer in reach.

Questions about Visualize & Share with Sundial

How do Apps differ from Reports and Artifacts?
Apps are live, interactive views for metrics and decisions that recur. Reports, called Artifacts in Sundial, are polished HTML deliverables for sharing a one-time finding or deep dive. Choose an App when people need to return to the work and an Artifact when they need a snapshot of it.
Which output should I choose?
Use an App for ongoing exploration, a Report for a polished narrative and visual summary, and a file when the work needs to travel into a meeting, inbox, or another workflow.
How does live data differ from a snapshot?
Apps retrieve current data when you open them or change a supported selector. Reports and files preserve a point-in-time deliverable that can be shared or downloaded for a specific decision.
Which file formats can Sundial create?
Depending on the work, Sundial can create PDFs, PowerPoint Slides, Excel workbooks, CSV files, and Word documents alongside HTML reports.
How do teams keep outputs organized?
Save and share Apps and Artifacts through the Library, favorite the work you return to, and use version history to compare, restore, or reuse earlier work where supported.
How do outputs keep metrics consistent?
Sundial starts with governed semantic measures and dimensions whenever they fit the work. Depending on the workspace, teams can also inspect the supporting definitions and SQL behind the analysis.

Give every answer a life beyond the conversation.

Turn trusted analysis into something your team can keep using, sharing, and acting on.